When you log in you are taken to your custom home page, called the Dashboard. The dashboard provides a snapshot of your
available asset creation types, messages, workflows, checked-out assets and history. Return to this area any time by clicking the
Home button on the Cascade menu bar. 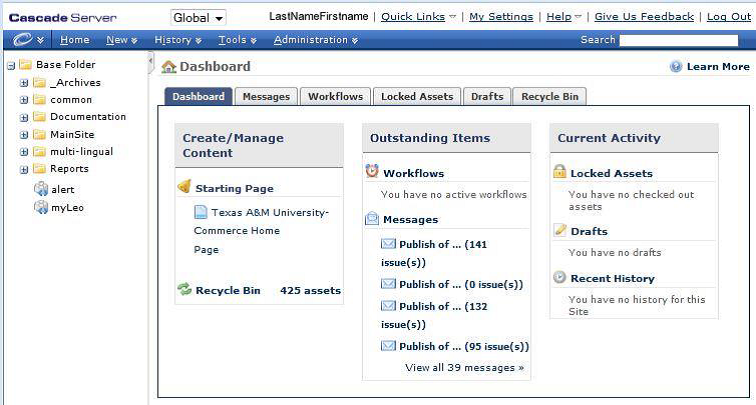
The main editing window displays your personal dashboard –Create/Manage Content, Outstanding Items and Current Activity.
The Dashboard also shows your Starting Page. The starting page will show you a list of assets that are available for you to edit. Based on your role, you will be given admin rights for your assigned pages.You will also see sections for Messages, Workflows, Locked Assets, Drafts and Recycle Bin. Clicking on one of these Dashboard tabs will enable you to view a more comprehensive listing of each category.
Now looking to the left, you’ll see the Asset Tree Workflows, in the left side bar. This is where your site is managed. Under the Base Folder, you will see several additional folders (called top-level folders), each which represents a different site that can be managed independently of the others with different levels of users access all from within one interface. You can collapse the asset tree by clicking on the minus sign or expand the tree by clicking on the plus sign.
![]()